
The relationship between GDP production and GDP use in terms of calculation is expressed in the following general formula:
GDP production | = | Accumulate assets | + | Final consumption | ± | Export and import of goods and services | ± | Error in calculation |
The structure of GDP use from 2019 to 2023 is as follows (Table 1). Looking at the uses, we can comment on some main features.
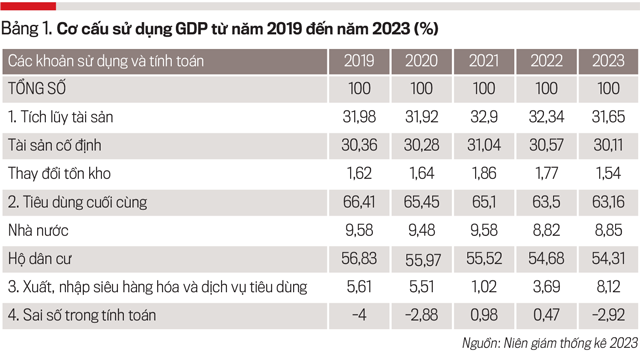
ACCUMULATE ASSETS
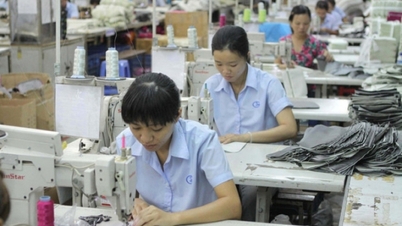
Regarding positive results, Vietnam's asset accumulation compared to GDP is among the highest in Southeast Asia (2), in Asia (6) and in the world (14/142 countries and territories with comparable data). This is the result of the "save food for emergencies" mentality of the majority of the population; it has led to many positive results (such as low foreign debt/GDP ratio, low budget deficit, and several years of bumper harvests...).
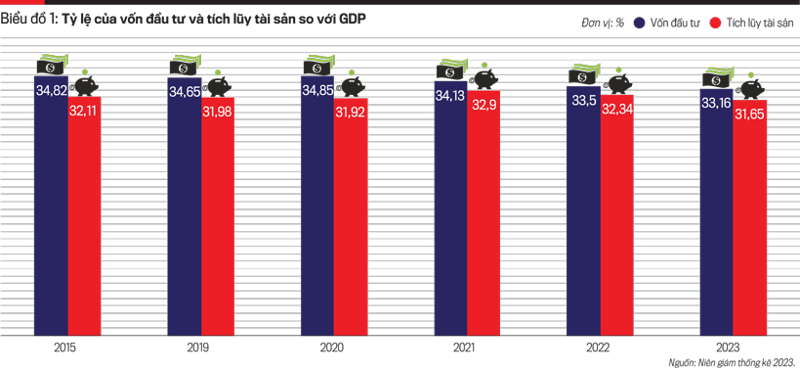
Accumulation is mainly concentrated in fixed assets; the proportion of inventory changes is small... The high accumulation/GDP ratio creates the premise to increase the ratio of realized investment capital/GDP to a fairly high level, ranking first in the world. Specifically: realized investment capital/GDP in 2019 was 34.65%, 2020 was 34.84%, 2021 was 34.13%, 2022 was 35.5% and 2023 was 33.17%.
The high accumulation rate has contributed to Vietnam's GDP growth reaching the top in the world for the number of consecutive years (44 years, only lower than the record of 47 years currently held by China). Thanks to accumulation, investment and high growth, GDP per capita has surpassed the low-income group to the middle (low) group in 2008 and is likely to increase to the upper middle group, to the high income group in the Rising Era. Thanks to that, inflation has been controlled according to the target for the 11th year, trade surplus for the 10th consecutive year, unemployment rate is lower than the target, poverty rate has decreased, etc.
However, asset accumulation also has limitations and weaknesses.
Firstly, the pre-tax profit margin of the business sector is still quite low. In 2018 it was only 3.79%, in 2019 it decreased to 3.38%, from 2020 it increased slightly to 3.48%, in 2021 it reached 4.2% and in 2022 it reached 4.06%, according to the 2023 Statistical Yearbook.
In particular, the pre-tax profit margin of enterprises in many industries in 2022 is lower than the bank loan interest rate, even lower than the bank deposit interest rate, such as: manufacturing and processing industry 3.73%; production, distribution of electricity, gas, hot water, steam and air conditioning 2.77%; construction 1.52%; wholesale, retail, repair of automobiles, motorcycles, motorbikes and motor vehicles 1.04%; transportation and warehousing 2.59%; administrative activities and support services 1.84%; other service activities 2.36%.
In some industries and localities, this rate is even negative (loss), such as: accommodation and food services -4.19%; some specific industries (such as metal production -0.65%; production of motor vehicles, trailers -1.62%; repair, maintenance and installation of machinery and equipment -0.69%; air transport -27.41%; accommodation services -10.62%; food services -0.64%; cinematography, television program production, recording, music publishing -4.05%; radio and television broadcasting -7.99%; information service activities -2.40%; non-centralized social assistance activities -19.73%; centralized care and nursing activities -5.76%; library, archive, museum and other cultural activities -2.03%; creative, artistic and entertainment activities -0.76%); Some localities such as: Thai Binh -1.44%, Bac Kan -0.96%, Lang Son -0.65%, Phu Tho -0.40%, Thanh Hoa -2.37%, Ha Tinh -4.02%, Quang Binh -0.63%, Binh Dinh -7.40%.
In agriculture, forestry and fishery, many households, many plants and animals still practice the practice of "taking labor for profit"; in industry, the practice of "processing and assembling" still accounts for a large proportion, not only making actual revenue low (mainly due to cheap labor costs), but also causing large imports, even causing some countries to take advantage of Vietnam to avoid export taxes to markets, etc.
Second, the ratio of investment capital to GDP is larger than that of asset accumulation (chart 3). Although this situation has positive aspects, it has limitations and weaknesses in two aspects: (i) because investment is larger than accumulation, it causes an imbalance in investment compared to resources; (ii) in the context of budget deficit, this situation, if prolonged, is dangerous and will increase public debt and foreign debt.
Third, a significant portion of the total investment capital has been "buried" in channels that are not directly used for production and business, are speculative in nature (such as gold, real estate, etc.) and cause instability in these channels.
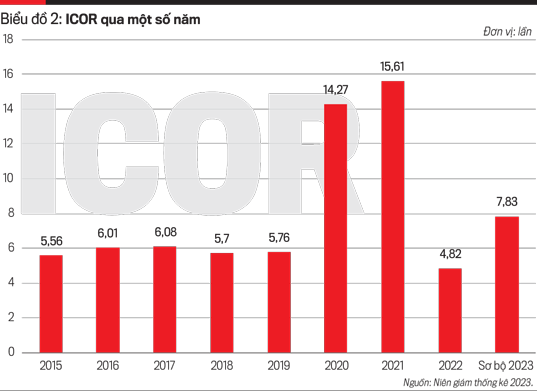
Fourth, investment efficiency is still low, when the ICOR coefficient (showing how much investment capital is needed to increase GDP by 1 dong - calculated at comparable prices) is still high compared to many advanced countries (about 3 times), even sky-high at over 14-15 times during the years of the Covid-19 pandemic (chart 2).
FINAL CONSUMER
Positive results are shown on three fronts.
Firstly, the ratio of final consumption in GDP has tended to decrease, which is one of the factors that increases the accumulation ratio and investment ratio in GDP. This is the effort of countries with low starting points, developing countries with the mentality of "saving for emergencies", even "tightening the belt" to save capital for development investment, in line with the current policy of saving and anti-waste.
Second, the State consumption rate is currently low at below 10% and has been on a downward trend; the downward trend will continue to be accelerated in the current process of streamlining the apparatus.
Third, the structure of income, expenditure, and consumption has shifted in a positive direction. According to the 2023 Statistical Yearbook, the difference in average monthly income per capita by urban, rural, and regional areas tends to decrease. Accordingly, the difference in average monthly income per capita between urban and rural areas in 2019 was 1.8 times, then decreased to 1.53 times in 2022; the highest region compared to the lowest region in 2019 was 2.38 times, then decreased to 1.91 times in 2023.
It is the effort to overcome the rural areas and areas with low starting points, due to the efforts of the rural areas, low-lying areas, the economic restructuring in rural areas and the State's support policies (through new rural construction, hunger eradication and poverty reduction, etc.).
The difference in average monthly expenditure per capita between urban and rural areas has decreased, but between the highest and lowest regions, there have been years when it increased and years when it decreased. Specifically: the difference in average monthly expenditure per capita between urban and rural areas in 2014 was 1.68 times, then decreased to 1.58 times in 2020 and 1.31 times in 2022; the highest region compared to the lowest region in 2014 was 1.57 times, 1.82 times in 2016, 1.67 times in 2018, 1.87 times in 2020 and 1.82 times in 2022 (according to the 2023 Statistical Yearbook).
The poverty rate tends to decrease over the years; in rural areas, some regions have decreased even more sharply (Table 2).
The average monthly consumption level per capita has changed, showing that the consumption structure has changed towards an increase in quality of life: spending on food and some items has decreased, spending on food, tourism, etc. has increased.
However, there are still some weaknesses in final consumption: the decrease in the final consumption/GDP ratio shows that final consumption - an important item, a major factor of growth - is still weak; waste is still large, especially in construction investment, in choosing between domestically produced goods and imported goods, etc.; the gap between income, consumption and spending, although decreasing, is still large...
EXPORT, IMPORT AND EXPORT, IMPORT DEFICIT
While the growth rate of domestic aggregate demand (including asset accumulation and final consumption) is still lower than that of GDP, the proportion of final consumption/GDP is decreasing,... exports, especially goods exports, have achieved many outstanding results.
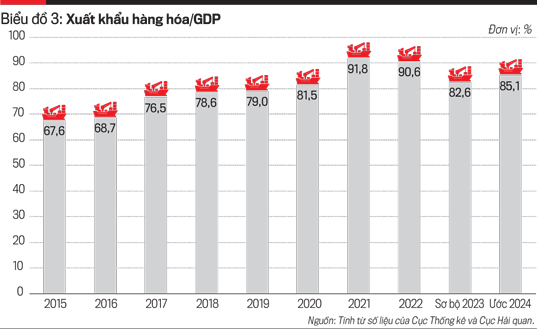
The growth in USD of merchandise exports has been higher than the growth rate of GDP for many years. As a result, Vietnam's merchandise exports/GDP have tended to increase and are among the highest in the world (chart 3). Thanks to the increase in exports and the larger scale of merchandise imports, the trade surplus has been achieved continuously from 2016 to present (chart 4).
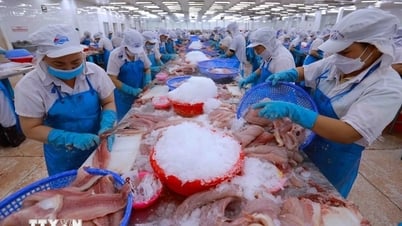
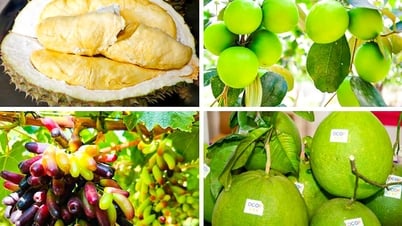
Many of Vietnam's export items have a scale of over 1 billion USD and have increased over the years: 2016 had 24, 2017 had 29, 2018 had 30, 2019 had 28, 2020 had 29, 2021 had 33, 2022 had 31, 2023 had 32, 2024 had 36. Among them, there are some items with the largest scale in the world, especially rice, footwear, textiles, some seafood, coffee, pepper, cashew nuts, some other agricultural and forestry products, electronic computers, phones and components, etc.
The number of localities reaching 1 billion USD or more is quite good and increasing (2016 had 25, 2017 had 28, 2018 had 31, 2019 had 33, 2020 had 31, 2021 had 36, 2022 had 38, 2023 had 38, estimated 2024 had 41). Of which, there are some localities reaching over 10 billion USD, the highest being Ho Chi Minh City with nearly 47 billion USD, Bac Ninh over 39 billion USD, Binh Duong nearly 35 billion USD, Bac Giang over 31 billion USD, Hai Phong over 30.5 billion USD, Thai Nguyen over 27.3 billion USD, ...
The "club" of markets with export turnover of over 1 billion USD is quite large, increasing over the years (2016 had 28, 2017 had 28, 2018 had 30, 2019 had 31, 2020 had 31, 2021 had 33, 2022 had 33, 2023 had 32, and it is estimated that 2024 will have 34). In 2024, some markets will reach over 10 billion USD, the highest being the United States with nearly 120 billion USD, China with over 61.2 billion USD, South Korea with over 25.6 billion USD, Japan with over 24.6 billion USD, the Netherlands with nearly 13 billion USD, Hong Kong with over 11.3 billion USD, the UK with nearly 6.6 billion USD, Canada with over 5.4 billion USD, etc.
It is the trade surplus of goods that has contributed to achieving a trade surplus of both goods and services, making an important contribution to the continuous and relatively good growth in recent times, even when domestic aggregate demand is still weak.
Besides positive results, import and export currently have some limitations and weaknesses.
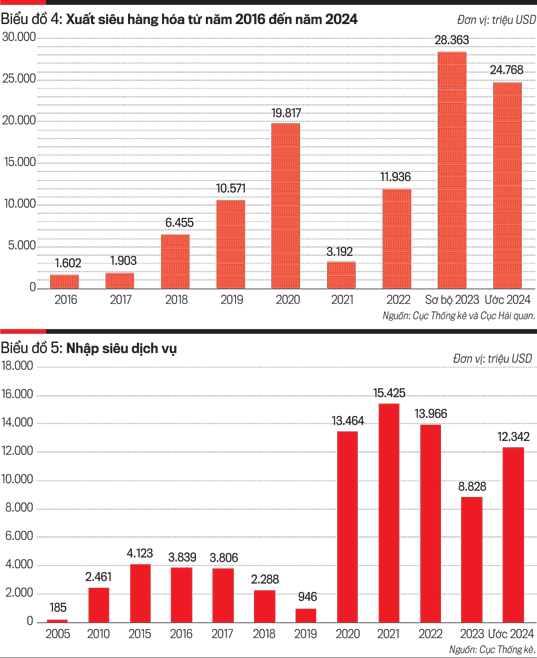
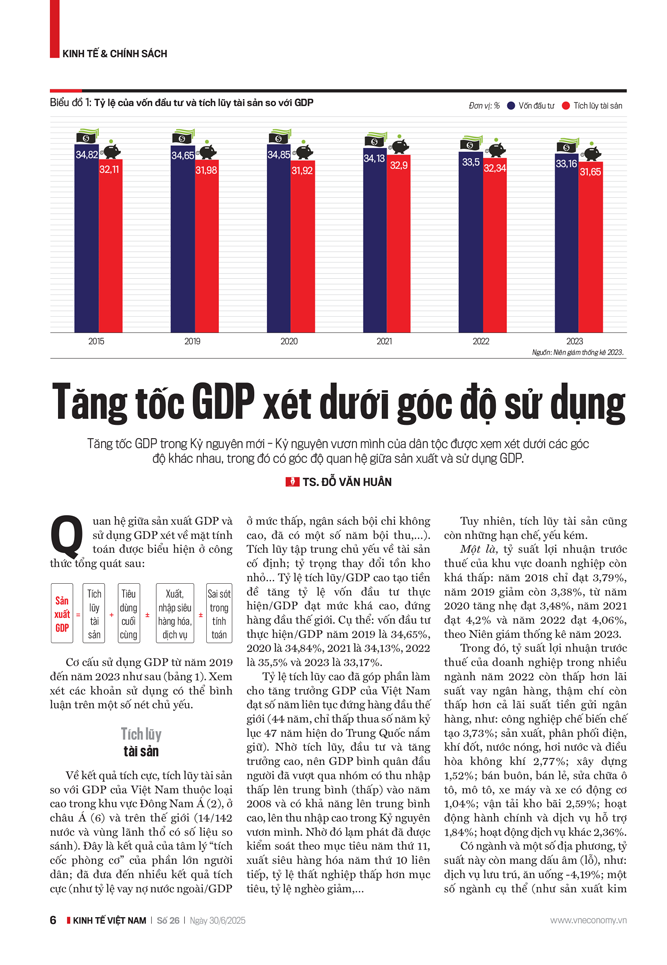
Services have a continuous large trade deficit (chart 5). The main reason is that service exports still account for a small proportion of the total export turnover of goods and services, and of the total GDP of the service sector; while service imports account for a higher proportion, are increasing and are on a larger scale, especially transportation services, tourism services, other services, etc.
In the total trade deficit of services, the trade deficit of transportation services is the largest and continuous due to the weakness of Vietnam's ocean transport; the trade deficit of other services is the second largest; some services (such as insurance, financial services, government services, etc.) are still weak. Even tourism services in some years (such as 2020, 2022, 2024) also have trade deficit.
Regarding goods, there are also many limitations and weaknesses. The domestic economic sector accounts for a small proportion of total export turnover (about 25%); the trade deficit is entirely created by this sector, while exports by the foreign-invested sector account for about 75% and account for the entire country's trade surplus. According to the ratio between national income (GNI) and GDP, it is below 95%, meaning that 5% of the total 476 billion USD (equivalent to 24 billion USD) is foreign-owned.
Meanwhile, in terms of thinking, the mistake of many people is that they still think that the export orientation of the economy is wrong, while there are many goods whose supply exceeds the (still weak) domestic demand; while exports from the foreign sector account for a large proportion and completely account for the trade surplus, while the economy is still in a state of large-scale assembly, cheap labor, etc.
ERROR IN CALCULATION
The difference (error) in calculating GDP by production method and by consumption method is still large. The error is almost unavoidable due to many reasons when balancing (due to time, price, inventory, exchange rate, etc.), mainly due to the fact that the calculation by consumption method is larger than the production method. This error will gradually decrease in the process of information technology modernization and more careful calculation...
The full content of the article was published in Vietnam Economic Magazine No. 26-2025, released on June 30, 2025. Readers are invited to read it here:
https://postenp.phaha.vn/tap-chi-kinh-te-viet-nam/detail/1473
Source vneconomy
View original linkSource: https://baotayninh.vn/tang-toc-gdp-xet-duoi-goc-do-su-dung-ts-do-van-huan-a191931.html


Comment (0)